Machine Learning--courses
机器学习(machine learning)
机器学习就是自动找函式
- speech recognition
- image recognition
- playing go
- dialogue system
要找什么样的函式?
| regression | 输入以前数据,预测未来数据 | pm2.5预测 |
|---|---|---|
| binary classification | 输入内容,输出yes/no | RNN:输入一个句子,输出pos/neg |
| multi-class classification | 输入内容,选择正确选项 | CNN:输入图片,输出类型 |
| generation | 产生有结构的复杂东西(文句、图片) | 产生文句、产生二次元图像 |
如何告诉机器?
训练资料
- supervised learning(label)(正确落子位置)
- 函式的loss(好坏)
- reinforcement learning(AlphaGo)(自己学习)
- unsupervised learning(无label)
机器如何找出所要的函式?
- 给定函式寻找范围 network architecture :RNN/CNN
- 函式寻找方法 gradient descent :PyTorch…
前沿研究
explainable AI、adversarial attack、network compression…(
一、Regression
Stock Market Forecast、Self-driving Car、Recommendation
Linear Regression
1、Case Learning
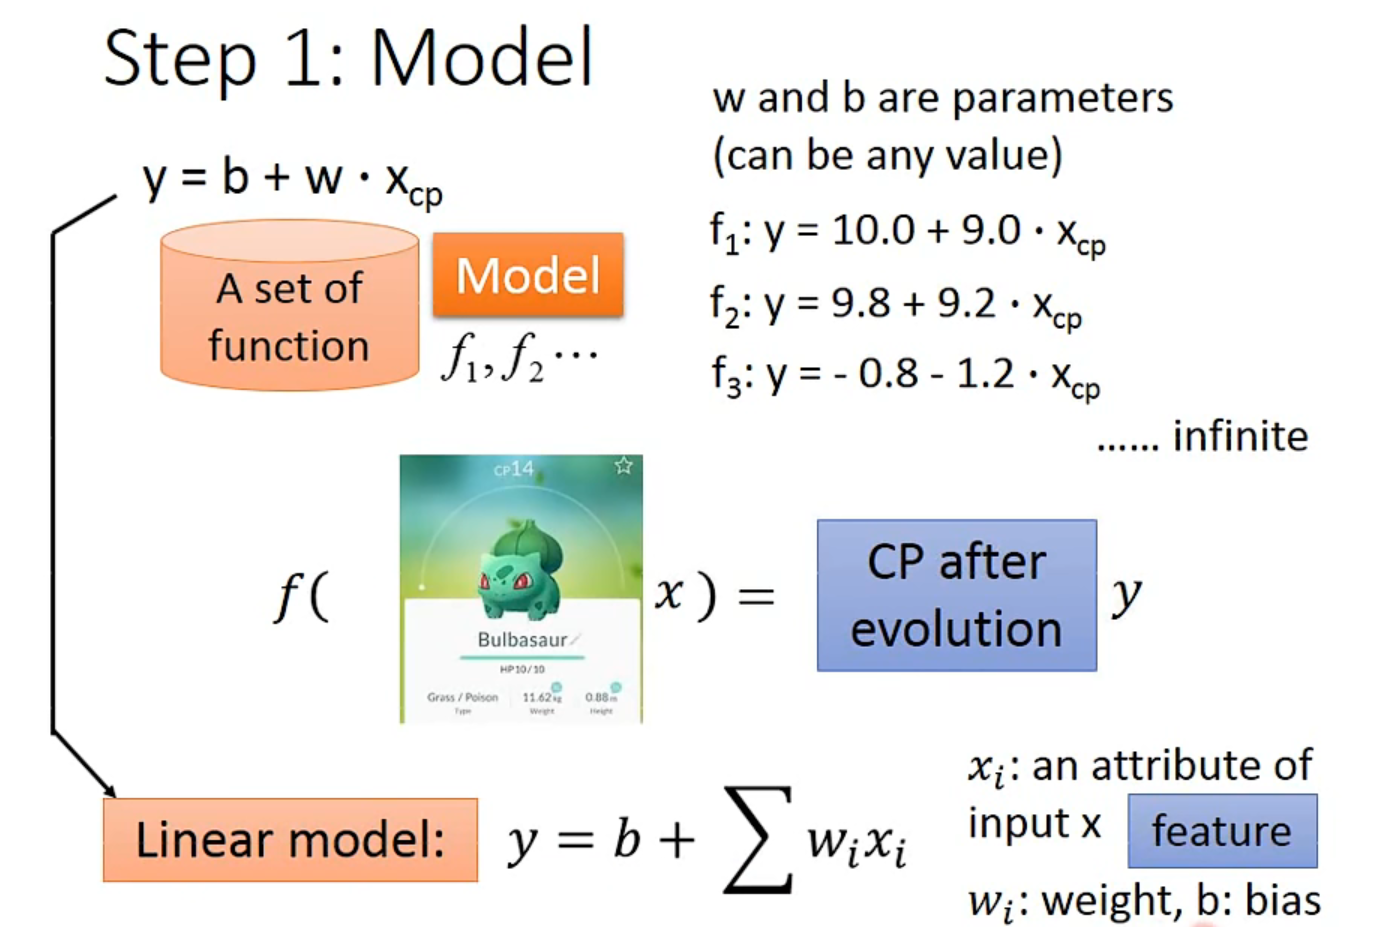
- machine learning :model(function set)->定义function->最好的function
Step 1: Model
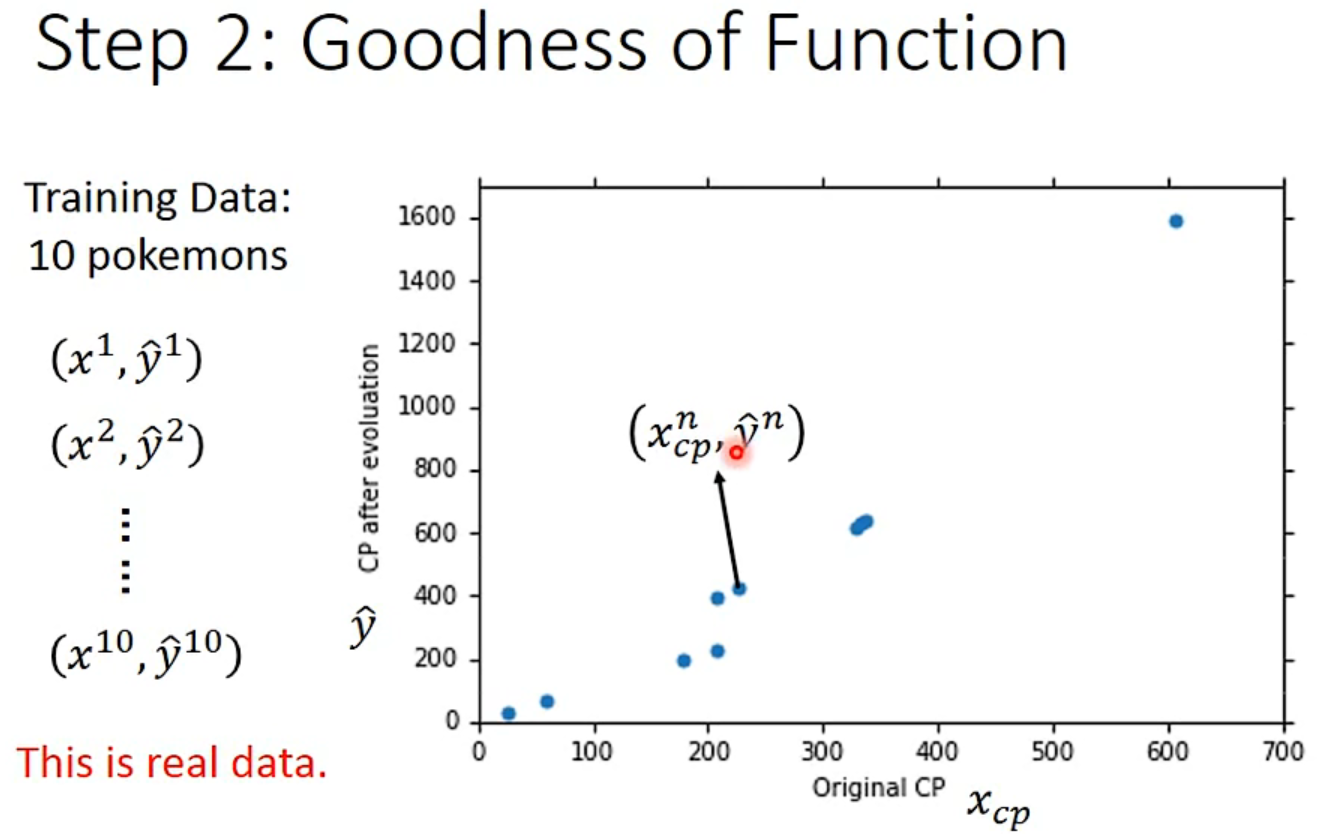
Step 2: Goodness of Function

Step 3: Best Function
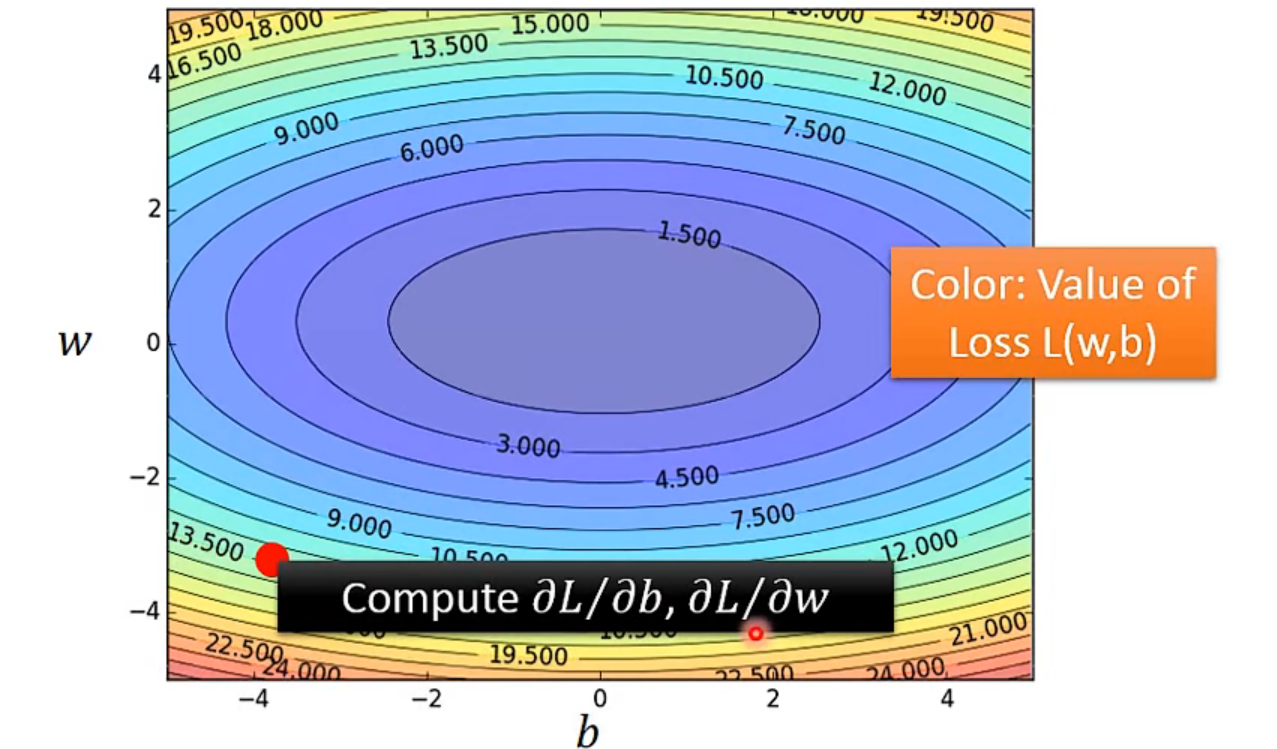
使用Gradient Descent来求出最小的L(f),即最好的function
Consider loss function L(w) with one parameter w:
- 随机选取一个$w^0$
- 计算$\frac{dl}{dw}|_w=w^0$ :若为正,向左移;若为负,向右移。找最小的(learning rate : $\eta$)
- 计算$w^1=w^0-\eta\frac{dl}{dw}|_w=w^0$
- 重复上述步骤$\frac{dl}{dw}|_w=w^1$ ……
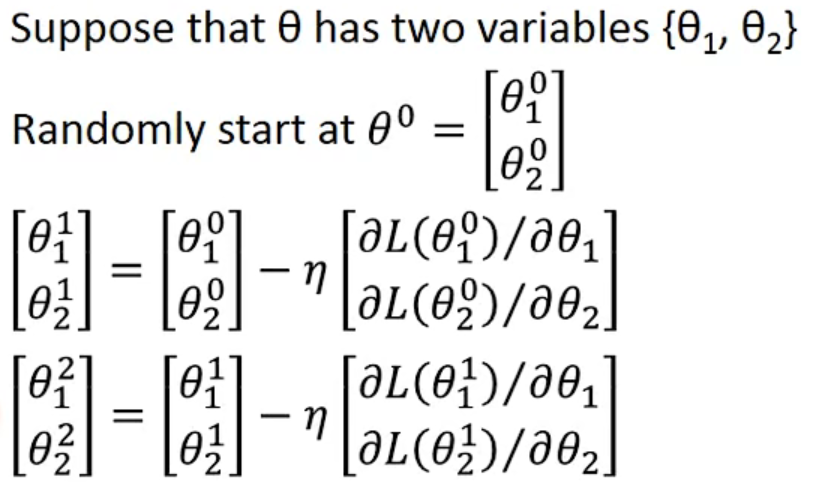
How about two parameter?
- 同理,不过微分变成偏微分
1. 上标为一个完整对象object ↩
2. 下标为一个对象的component ↩
由于计算出来的误差偏大,这里引入多次方式
#Selecting another Model
- $y=b+w1*x{cp}+w2*(x{cp})^2$
- $y=b+w1*x{cp}+w2*(x{cp})^2+w3*(x{cp})^3$
……
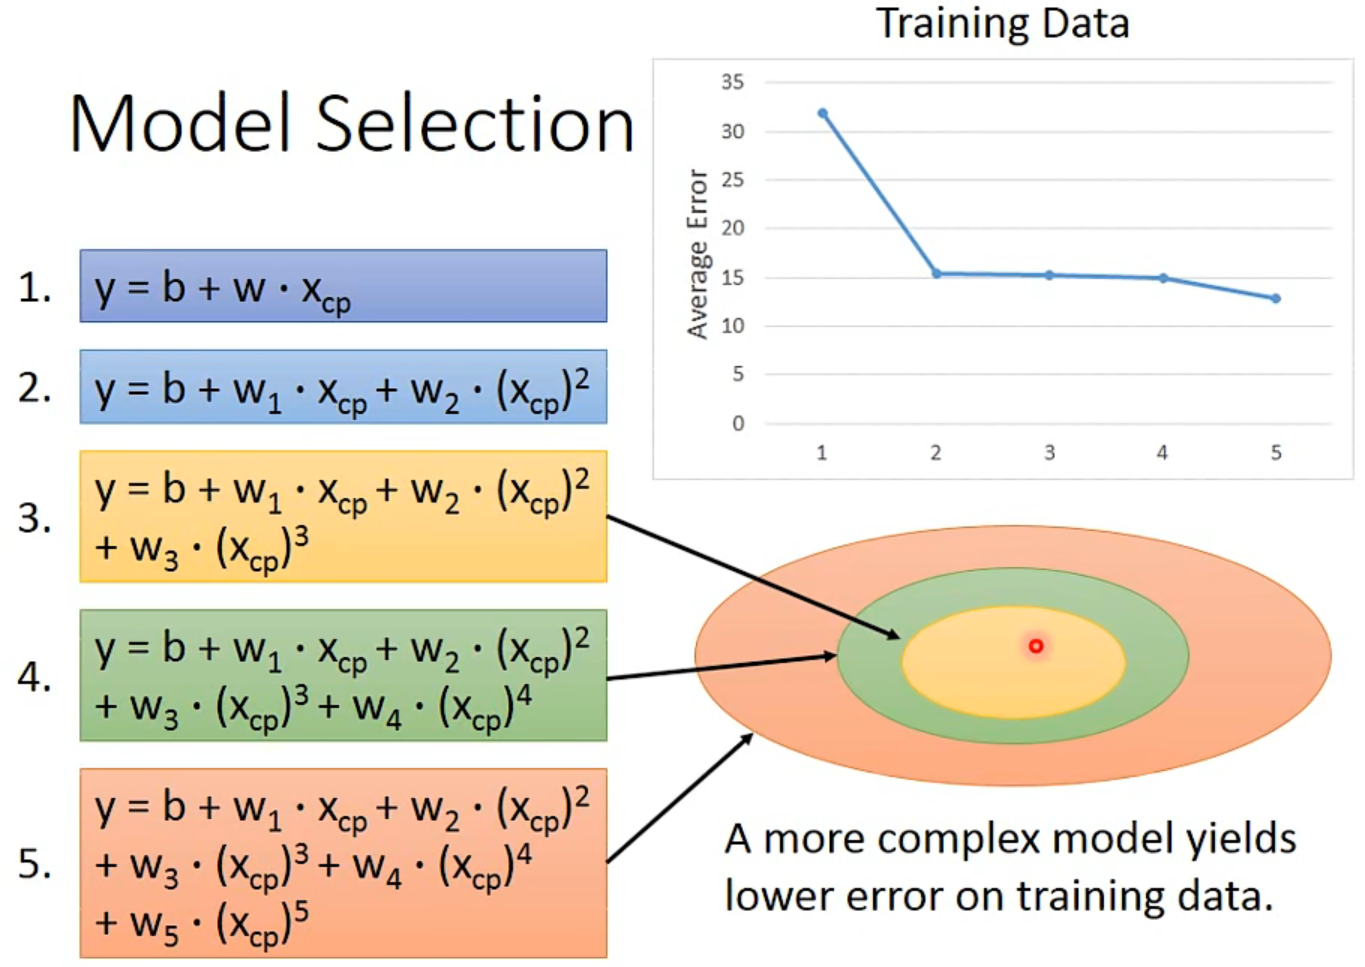
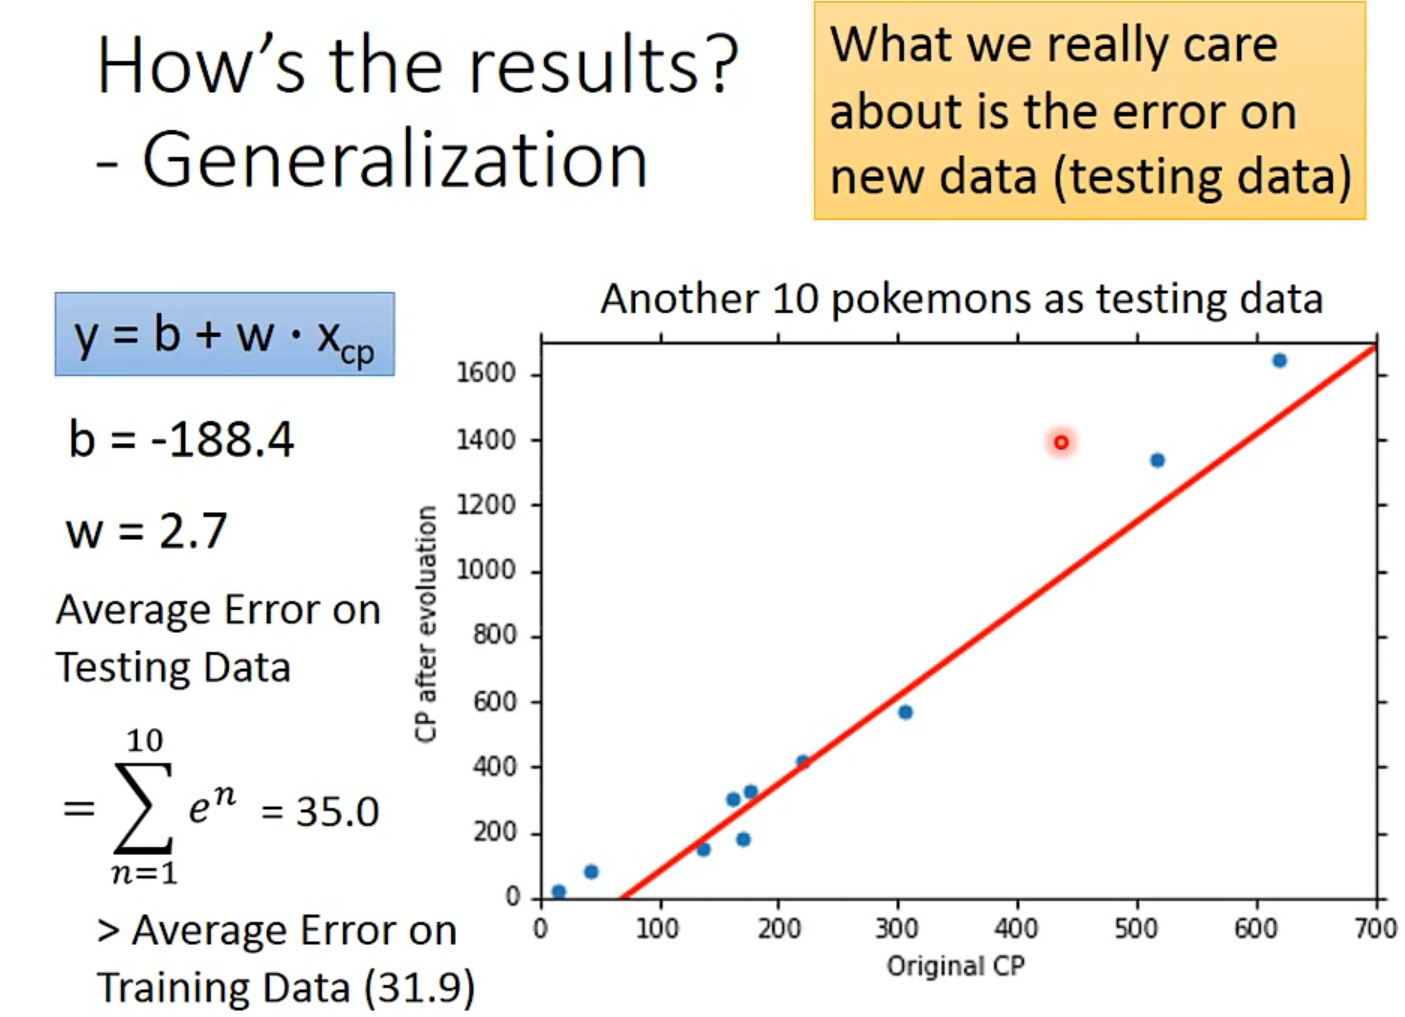
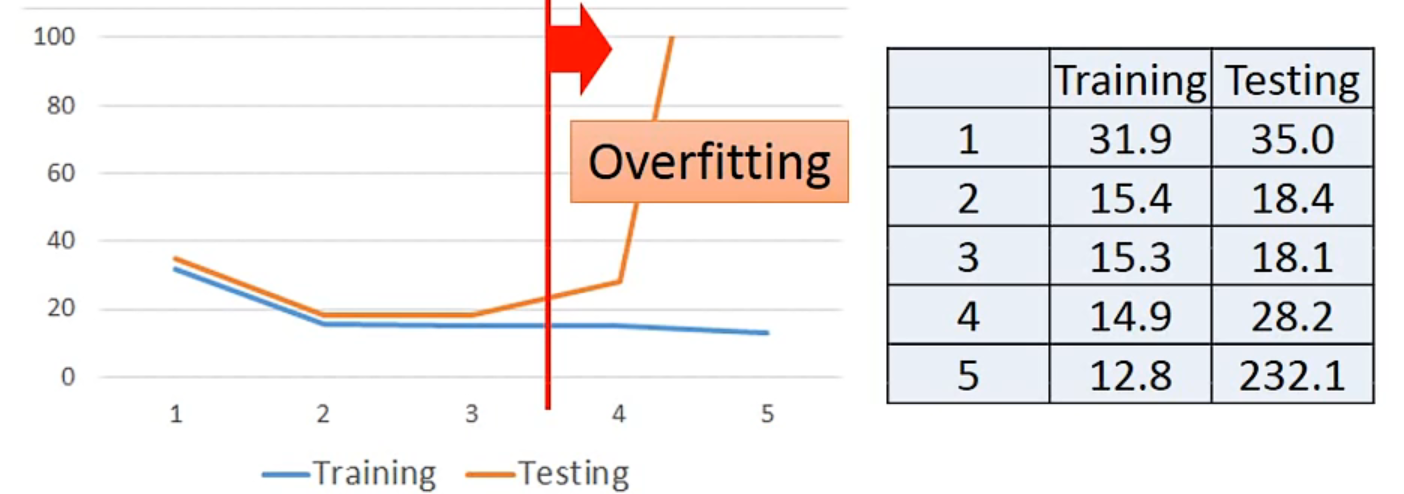
但是在testing data上又不一样,所以model不是越复杂越好
#Overfitting
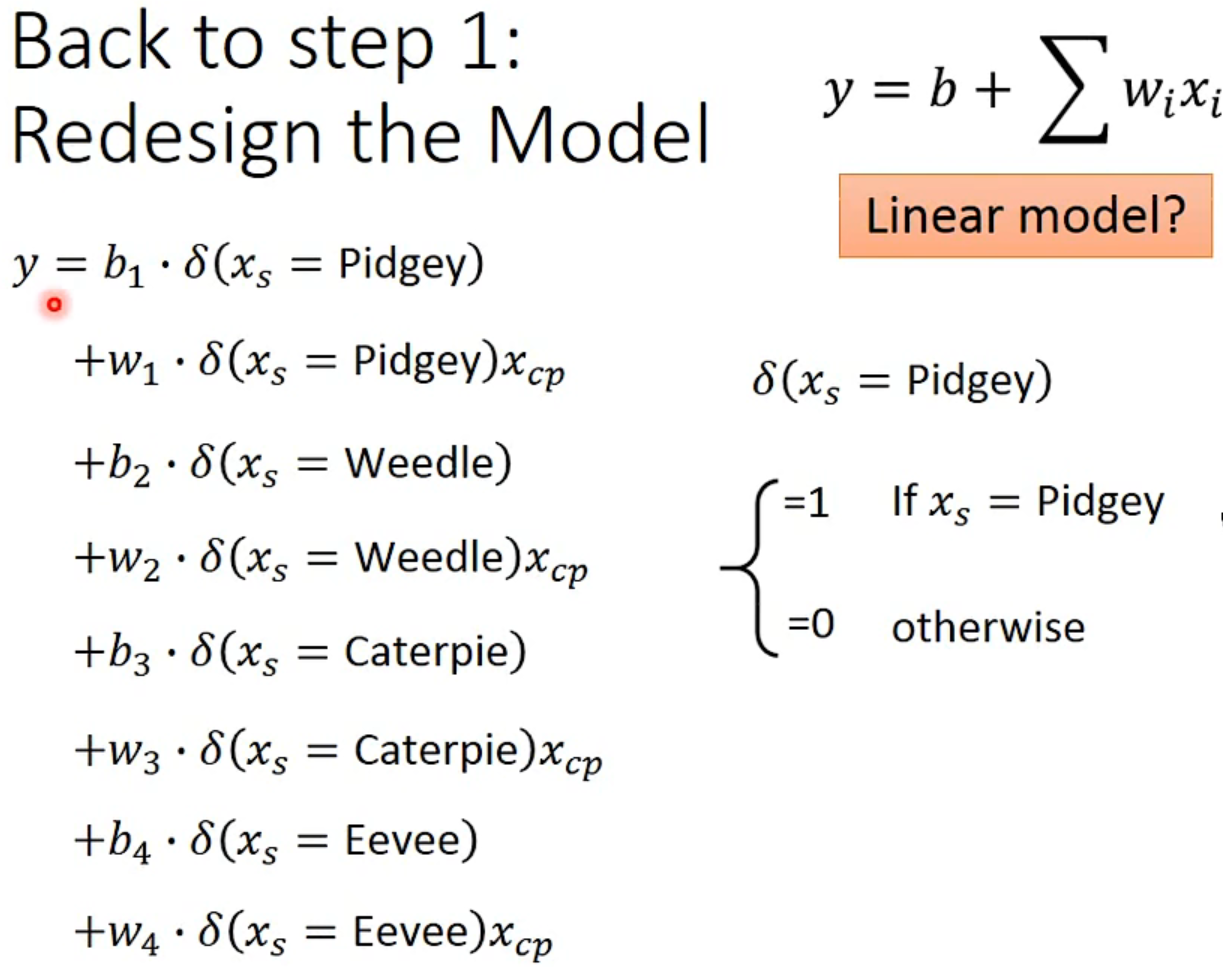
实际上会有很多数据和影响因素时:
Back to step1:
Back to step 2:
Regularization:redfine loss function.
L=$\sum_n(\hat{y}^n-(b+\sum{w_ix_i}))^2+\lambda\sum{(w_i)^2}$
The functions with smaller $w_i$ is better
- Prefer soomth function, but not too smooth.
-> select $\lambda$ obtaining the best model
Conclusion
- There are probably other hidden factors
- Gradient descent
- Overfitting and Regularization
- Validation
2、Basic Concept
Bias and Variance of Estimator
期望是没有bias,并且variance又小
Variance
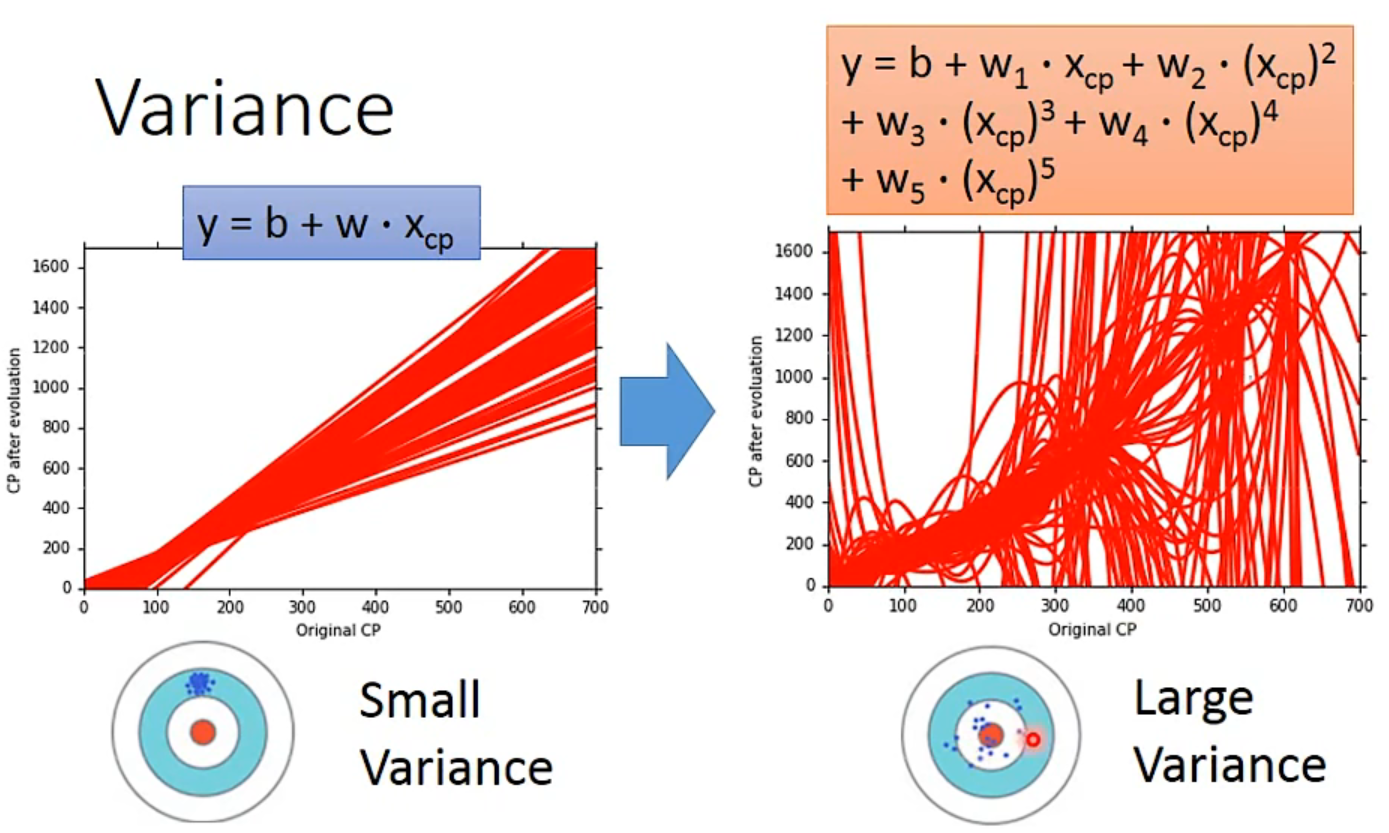
- Simpler model is less influenced by the sampled data
Bias
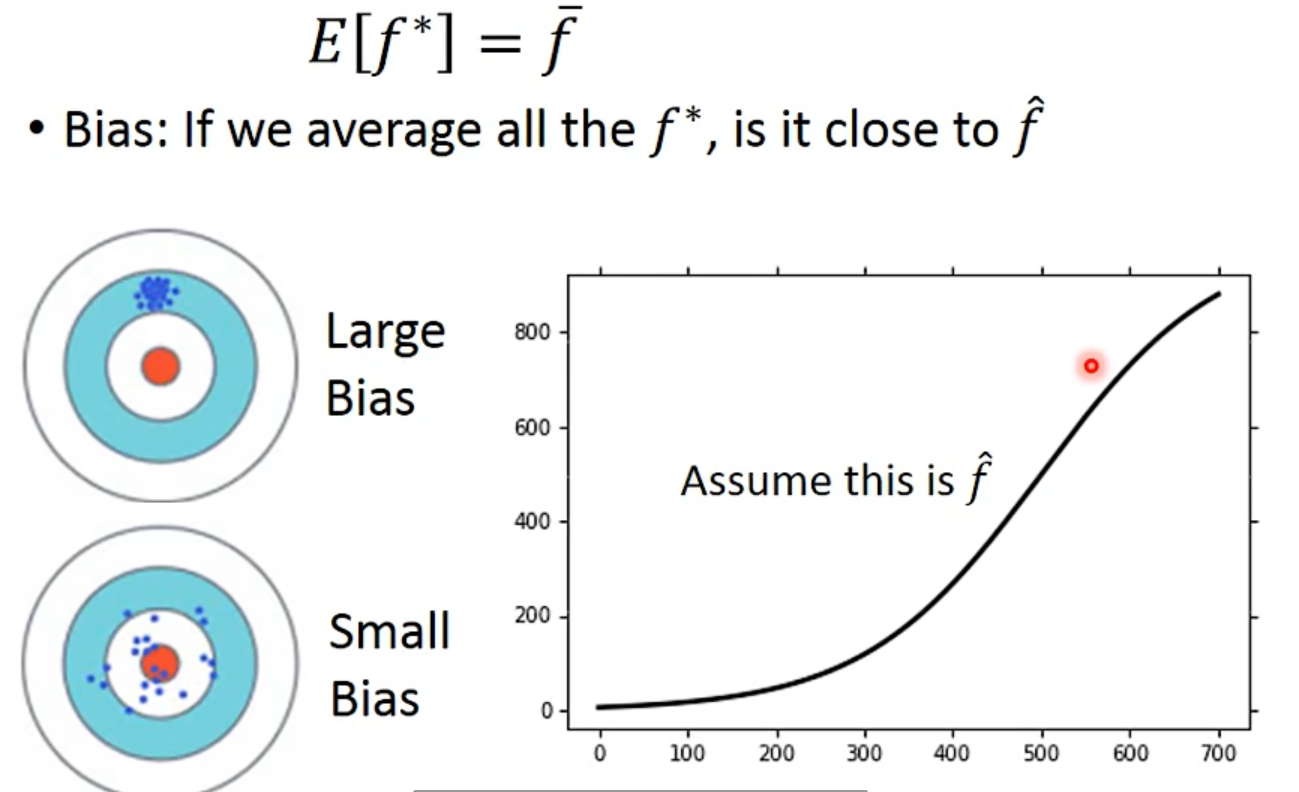
Bias v.s. Variance
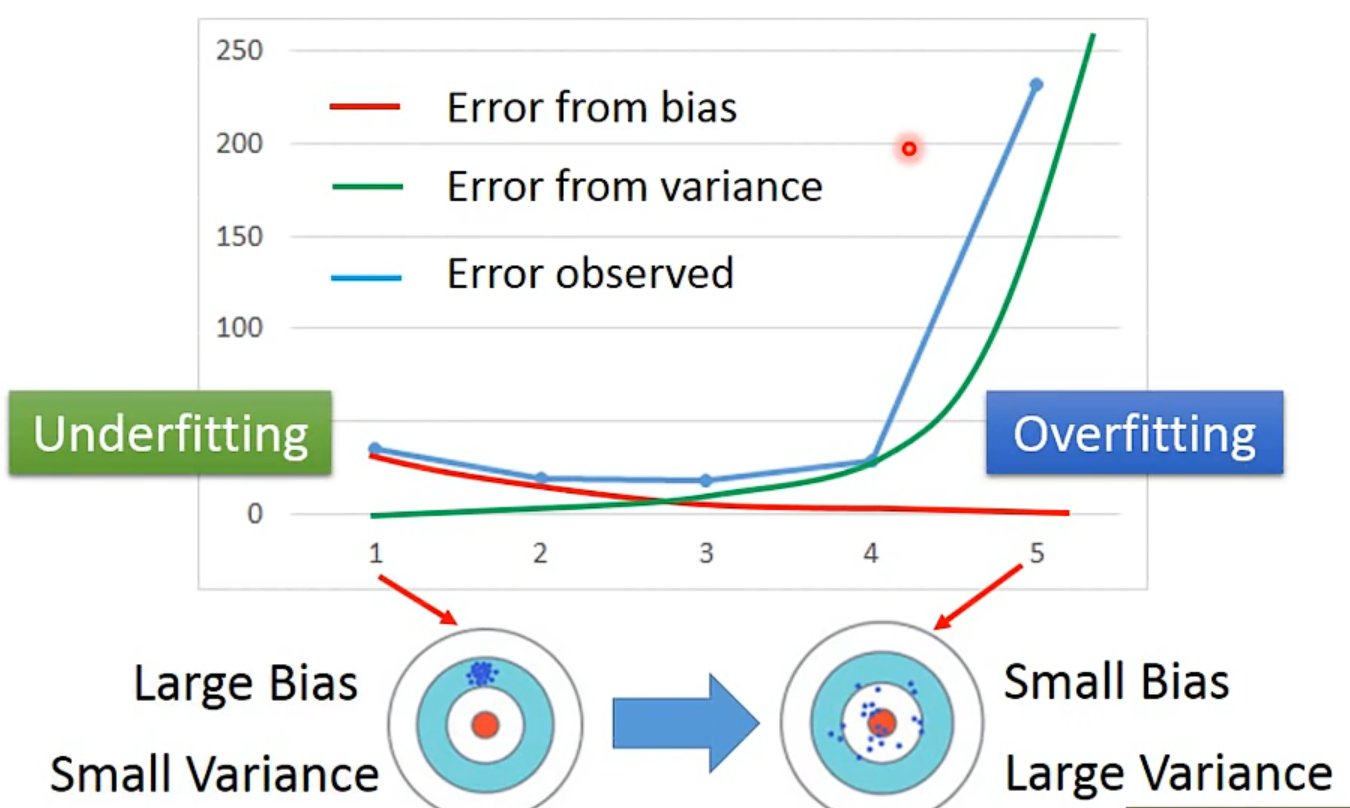
Diagnosis
underfitting:If your model cannot even fit the training examples, then you have large bais- redesign your model:
- add more featurers as input
- a more complex model
- redesign your model:
overfitting:If you can fit the training data, but large error on testing data, then you probably have large variance- more data: very effective, but not always practical
- regularization: 加一个weight*term, 但可能影响bias
#What you should not do
#What you should do
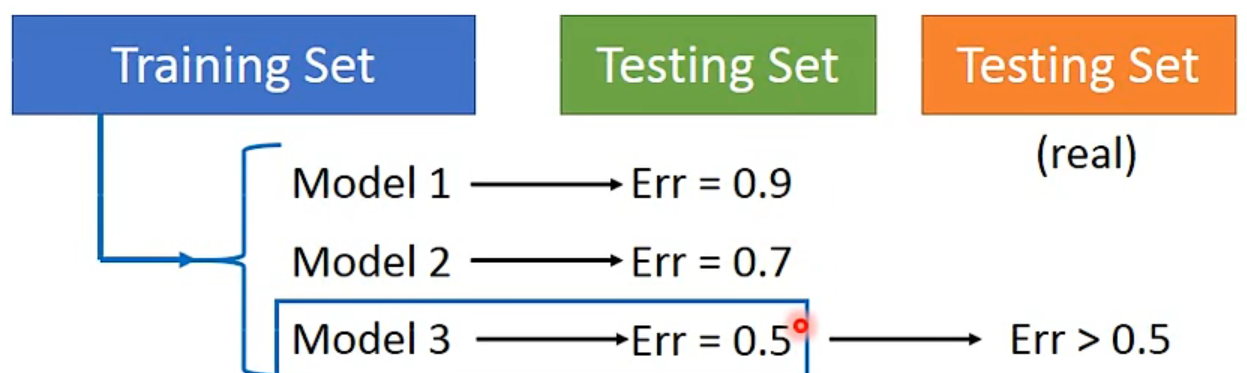
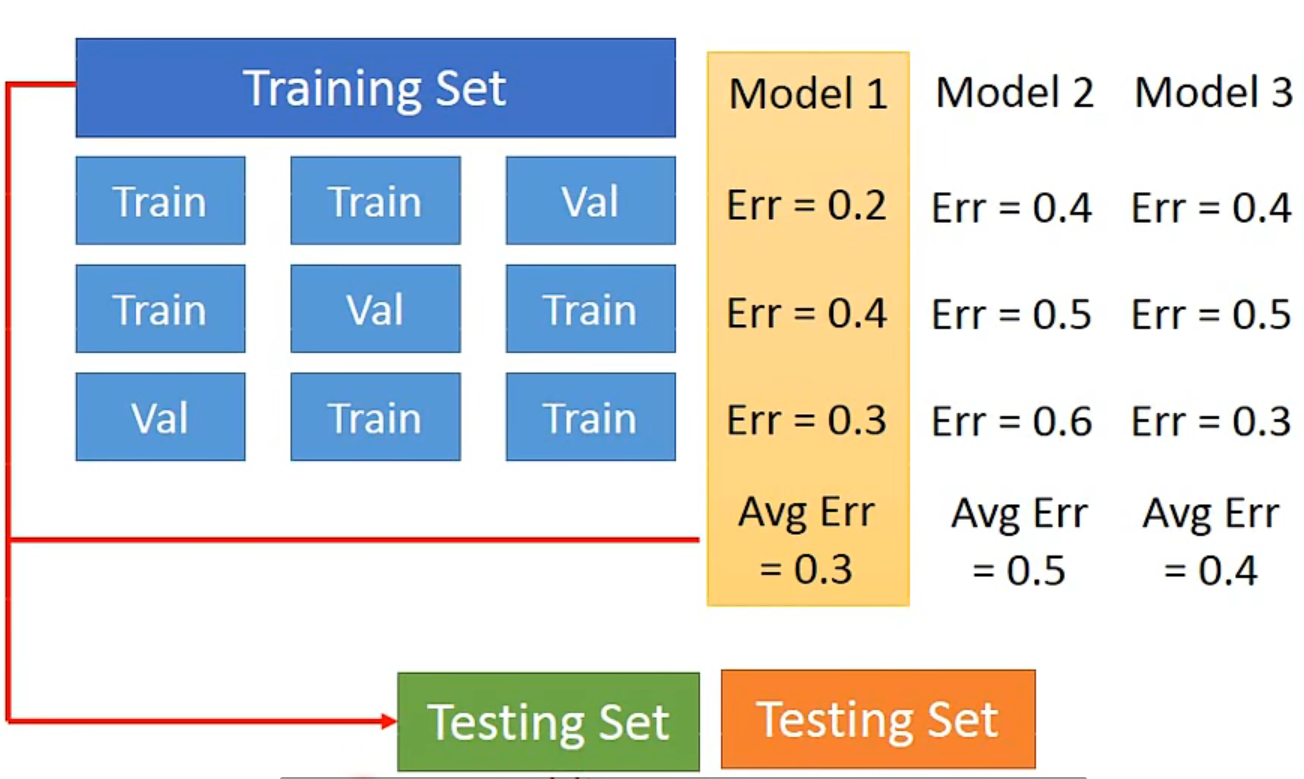
Cross Validation
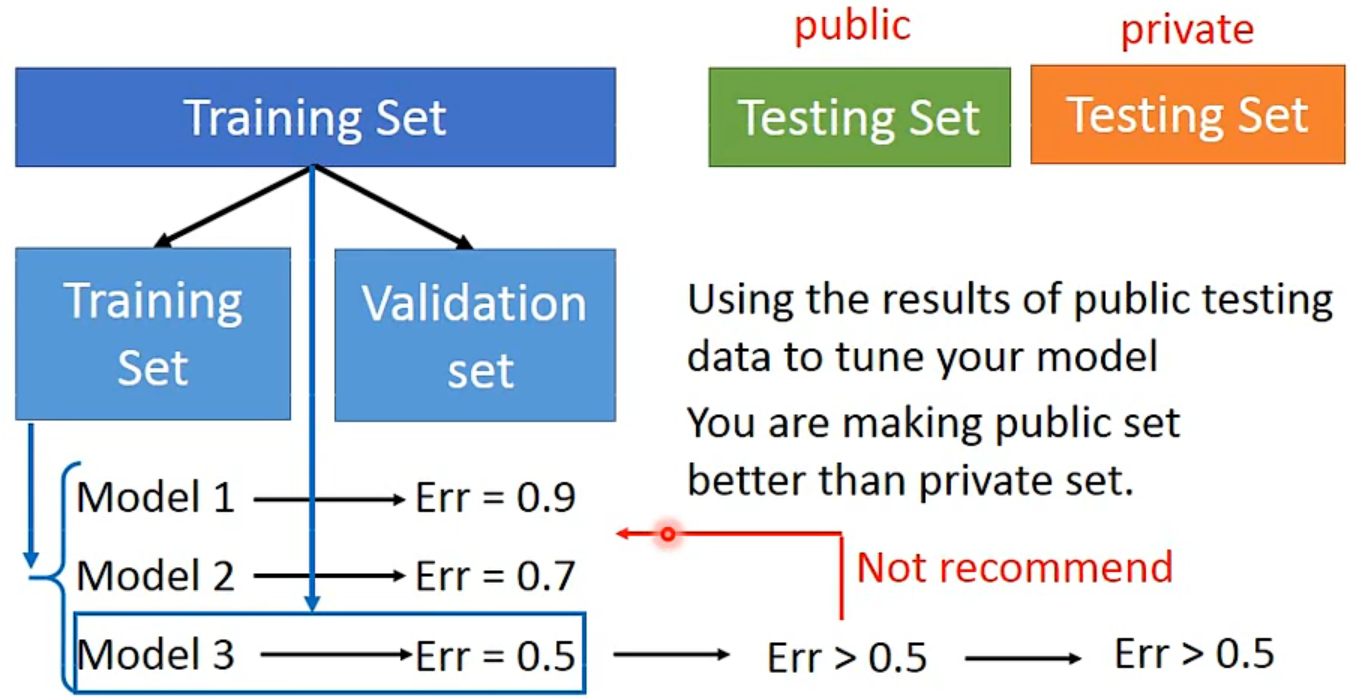
N-fold Cross Validation
3、Gradient Descent
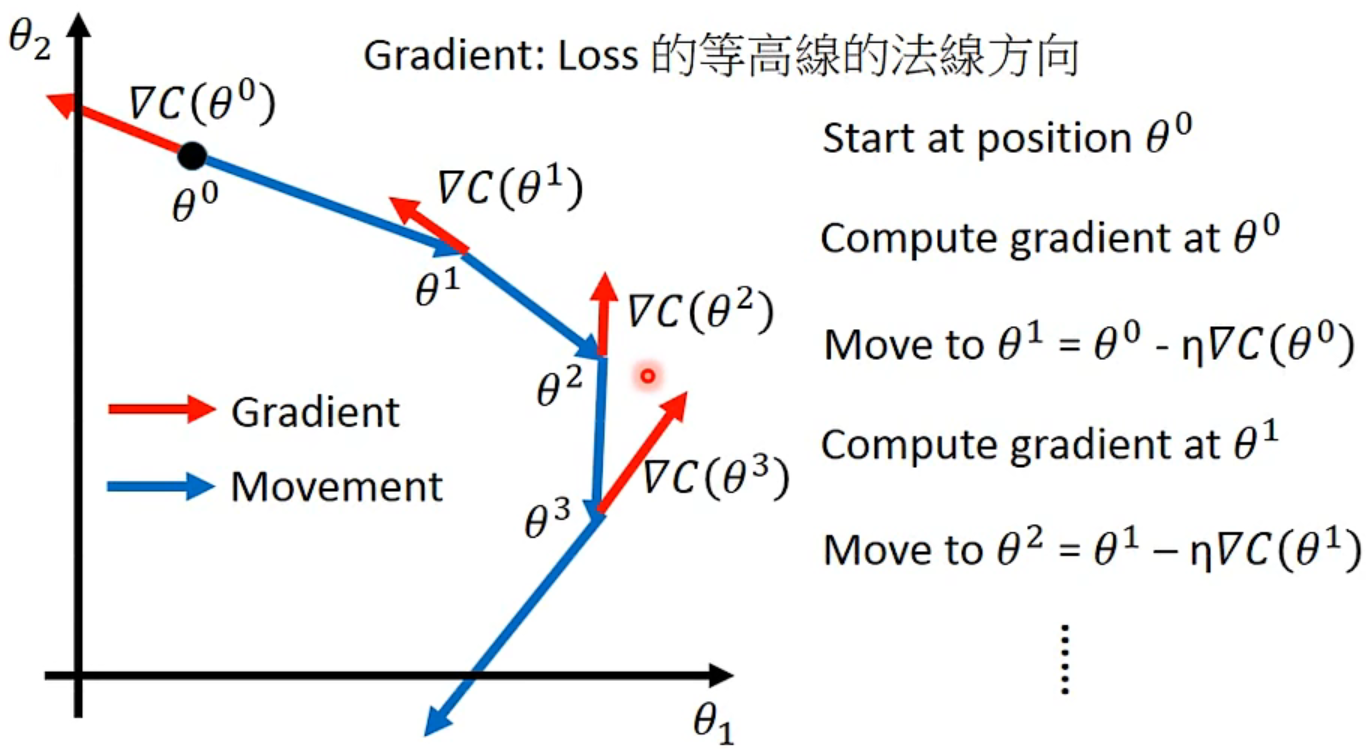
- 由之前的step3,得到Gradient Descent的大体步骤如下:
- Visualize
Tips
1、Tuning your learning rates
Set the learning rate $\eta$ carefully
- 太大会错过min
- 太小会走得过慢
解决方案:
Popular & Simple Idea: Reduce the learning rate by some facotor every few epochs.
- At the beining, we are far from the destination, so we use larger learning rate.
- After several epochs, we are close to the destination, so we reduce the learning rate.
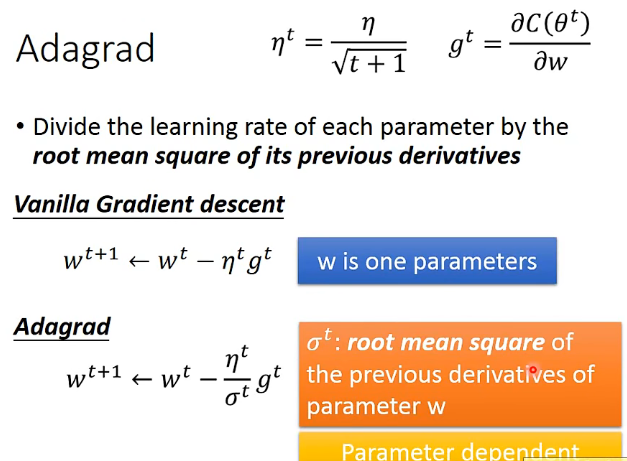
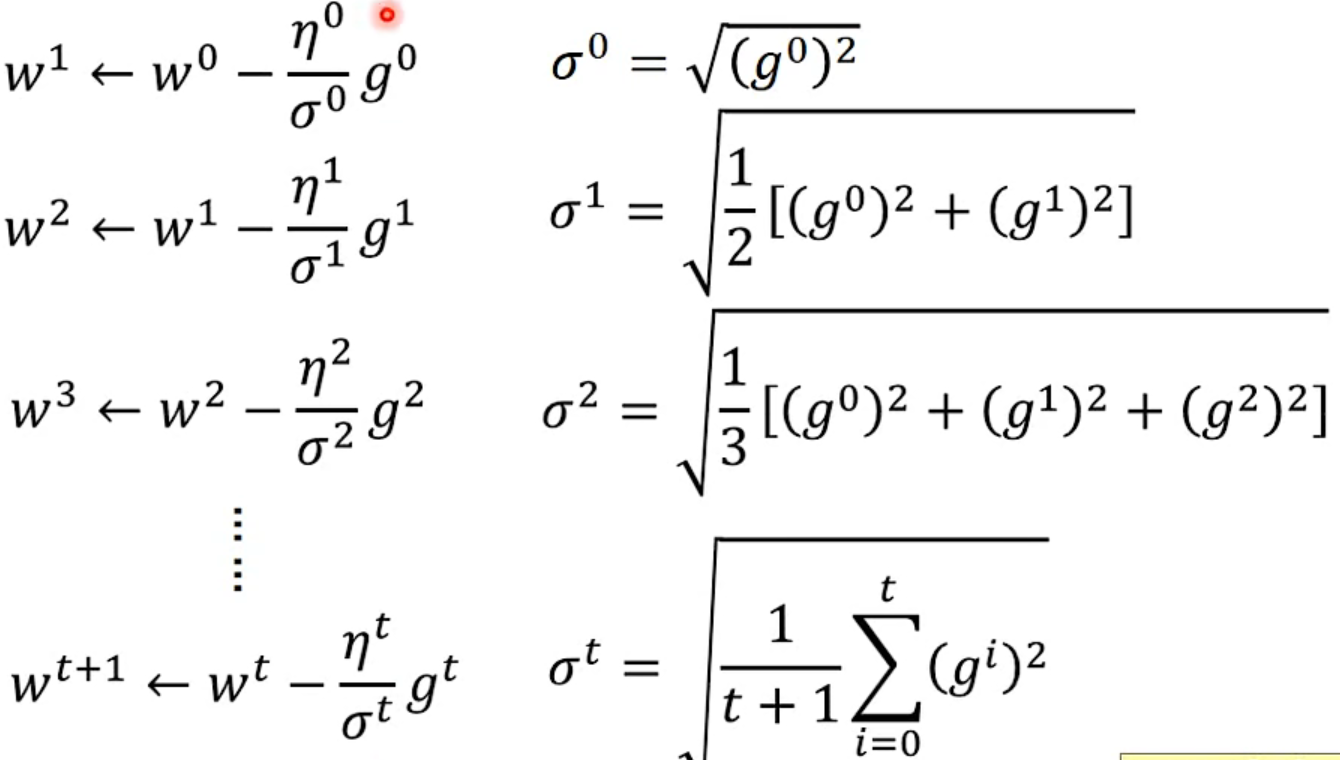
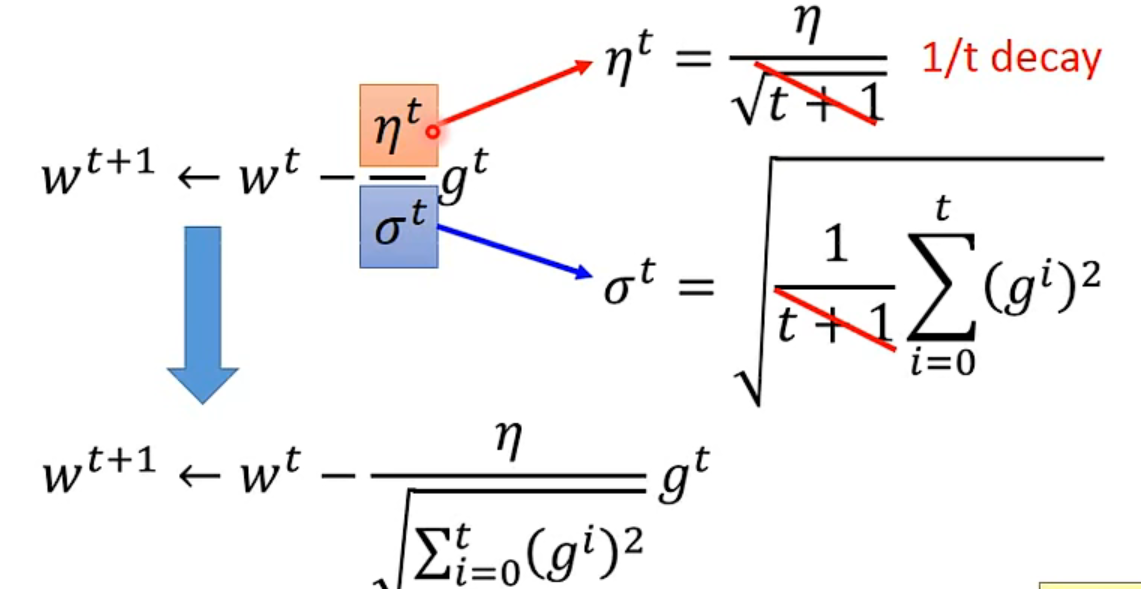
- E.g. $\frac{1}{t}$ decay: $\eta^t=\frac{\eta}{\sqrt{t+1}}$
Learning rate cannot be one-size-fits-all
- Giving different parameters different learning rates
Adagrad
Divide the learning rate of each parameter by the root mean square of its previous derivatives
总结
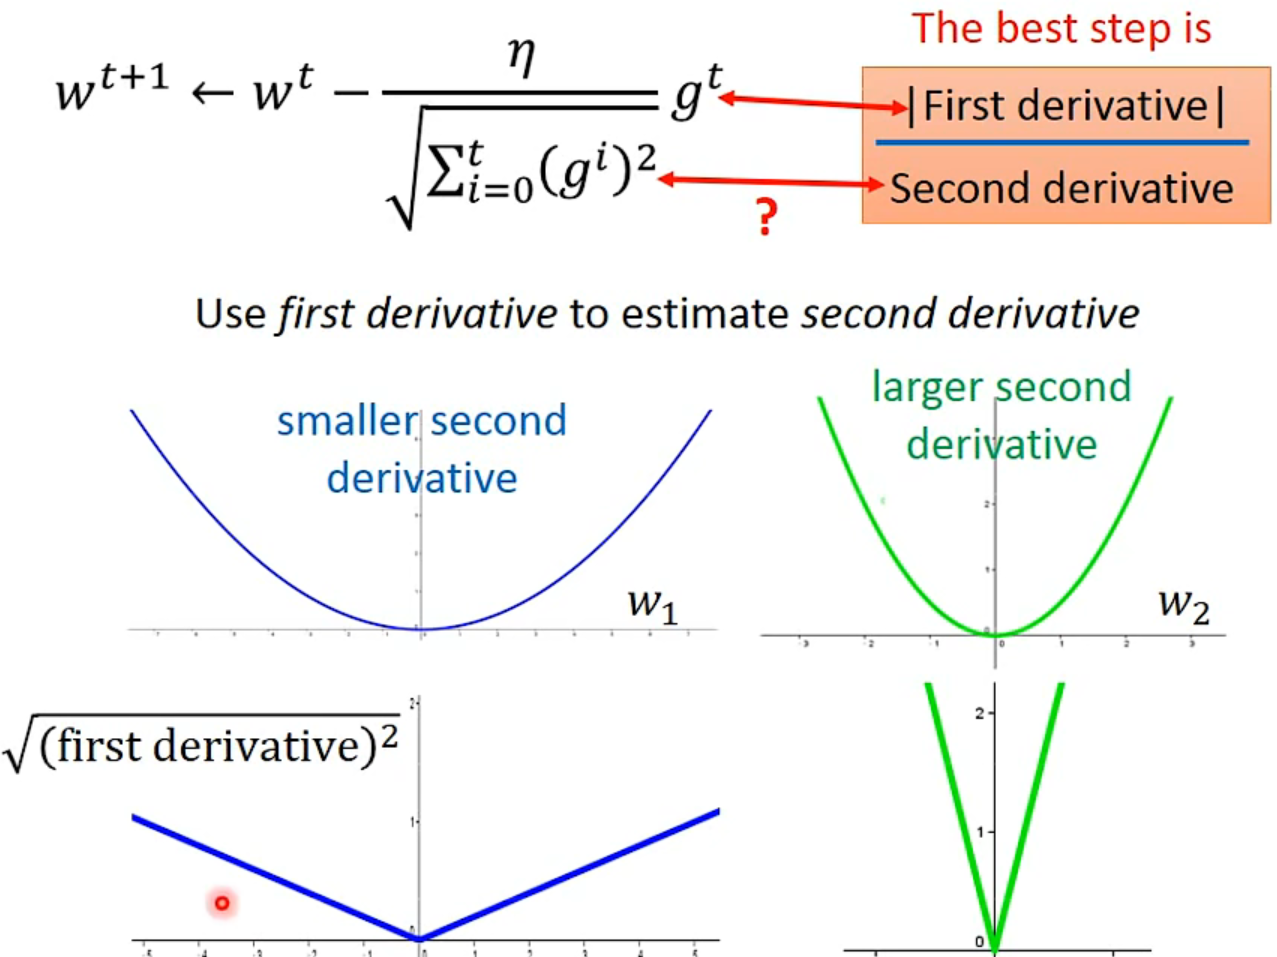
Intuitive Reason
反差效果
Comparison between different parameters…
- The best step is $\frac{First derivative}{Second derivative}$
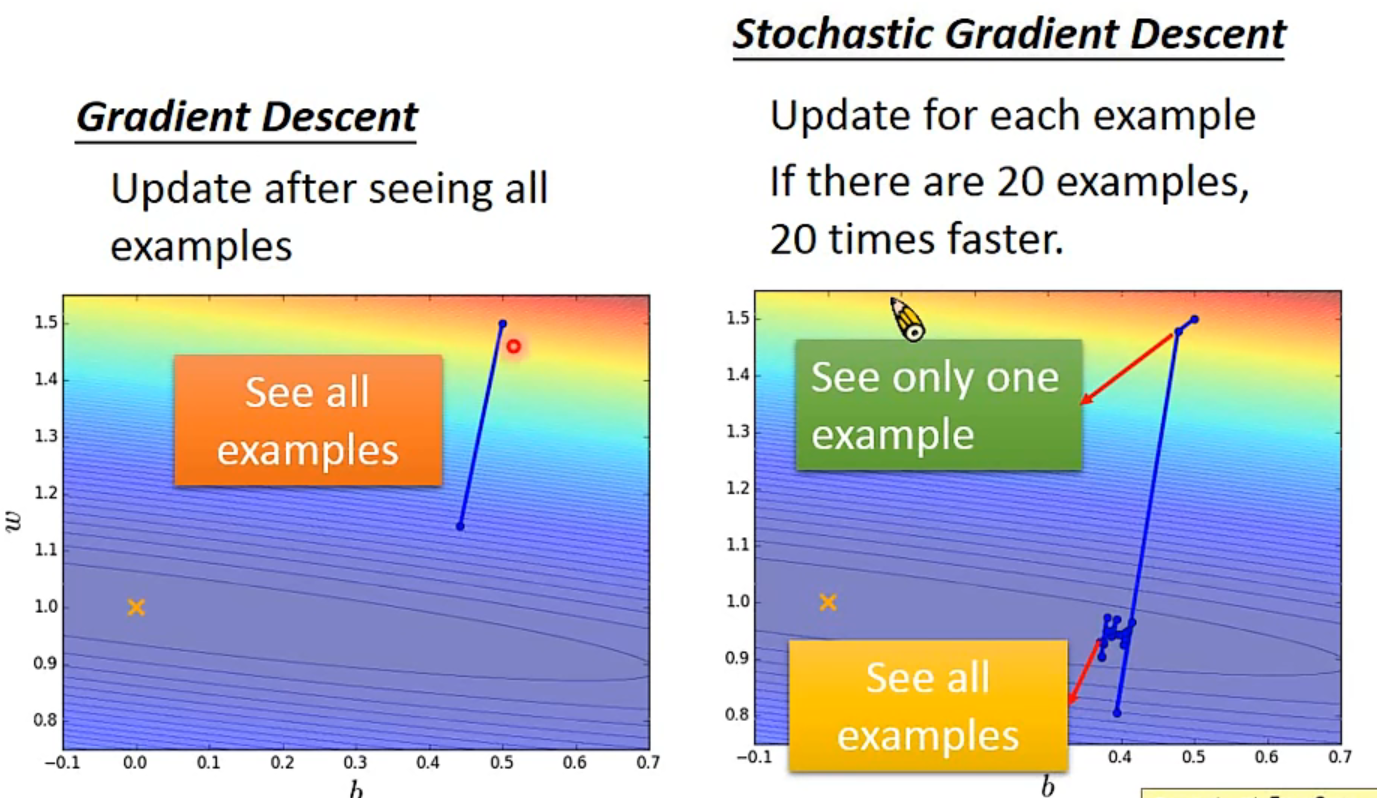
2、Stochastic Gradient Descent
Making the training faster
一个对比
3、Feature Scaling
Make different features have the same scaling
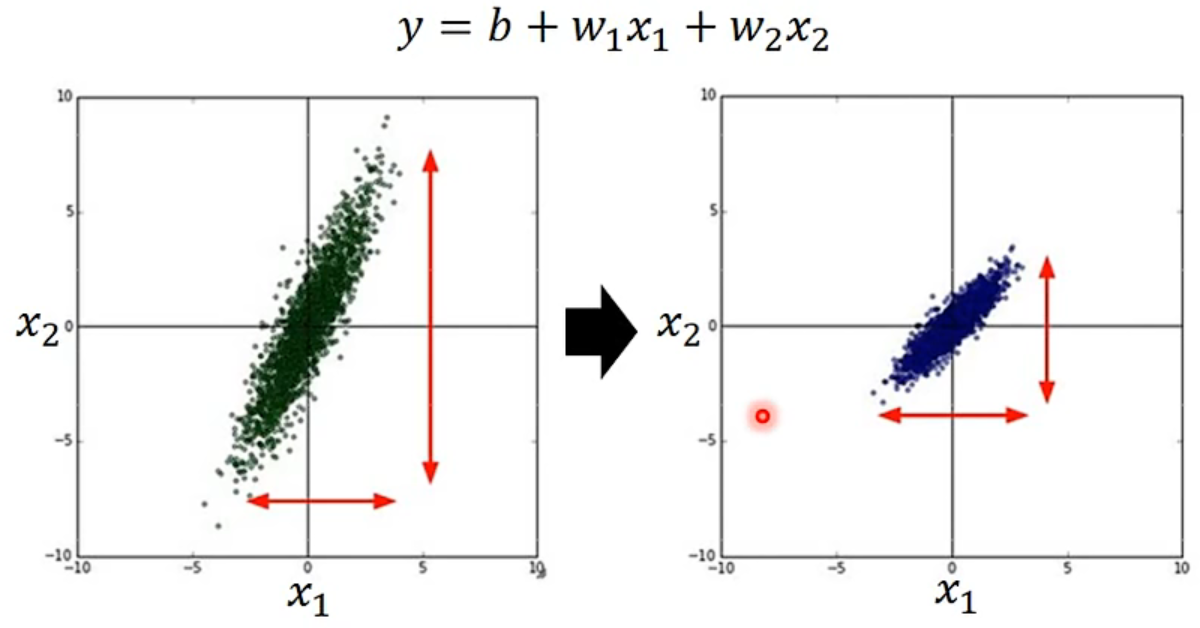 How to do it?
For each dimension i :
- mean: $m_i$
- standard deviation: $\sigma_i$
- $x_i^r=\frac{x_i^r-m_i}{\sigma_i}$
The means of all dimensions are 0, and the variances are all 1
Theory
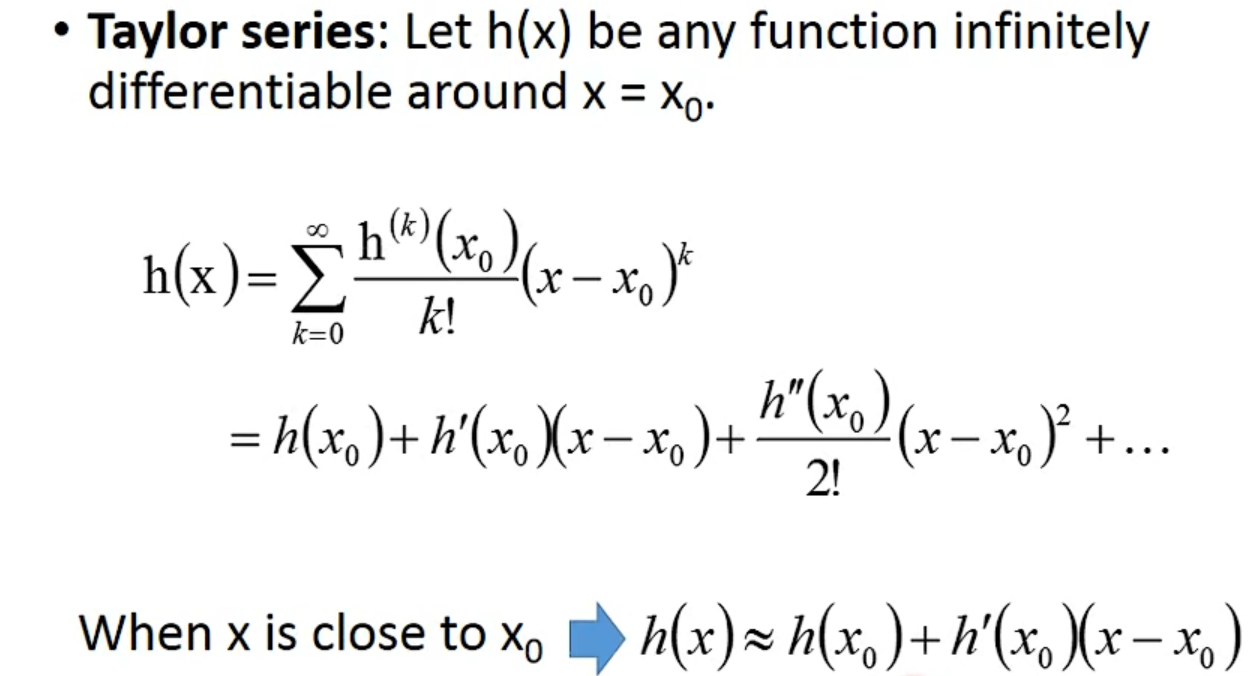
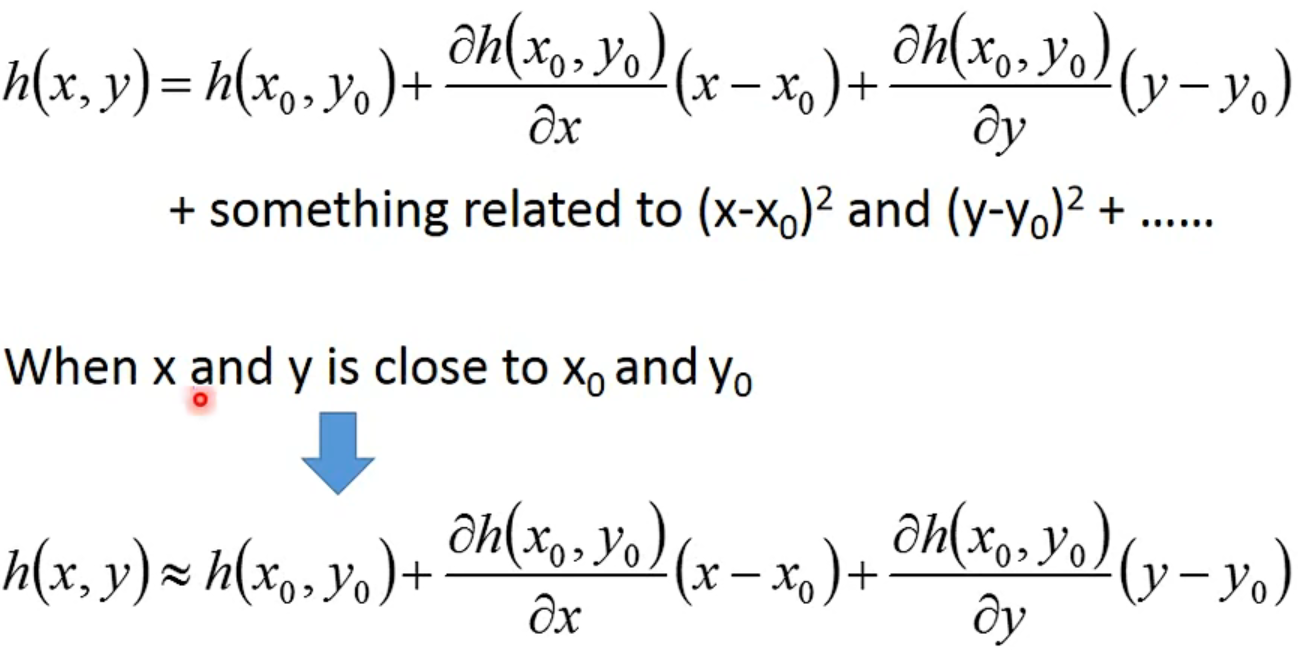
- Taylor Series
- Multivariable Taylor Series
- More Limitation of Gradient Descent
二、Classification
- Credit Scoring
- Medical Diagnosis
- Handwritten character recognition
- Face recognition
……
1、Case Learning
描述:vector->function=种类
- Total
- HP
- Attack
- Defence
- SP Atk
- SP Def
- Speed
How to do Classification
- Training data for Classification
用regression做:
- Ideal Alternatives
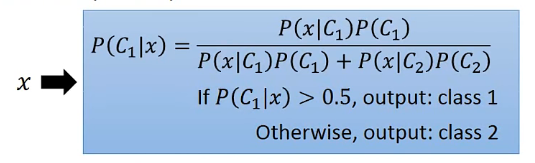
- Generative Model : $P(x)=P(x|C_1)P(C_1)+P(x|C_2)P(C_2)$
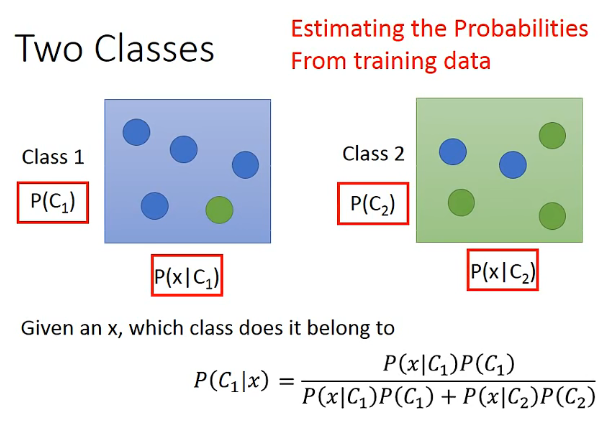
- Prior
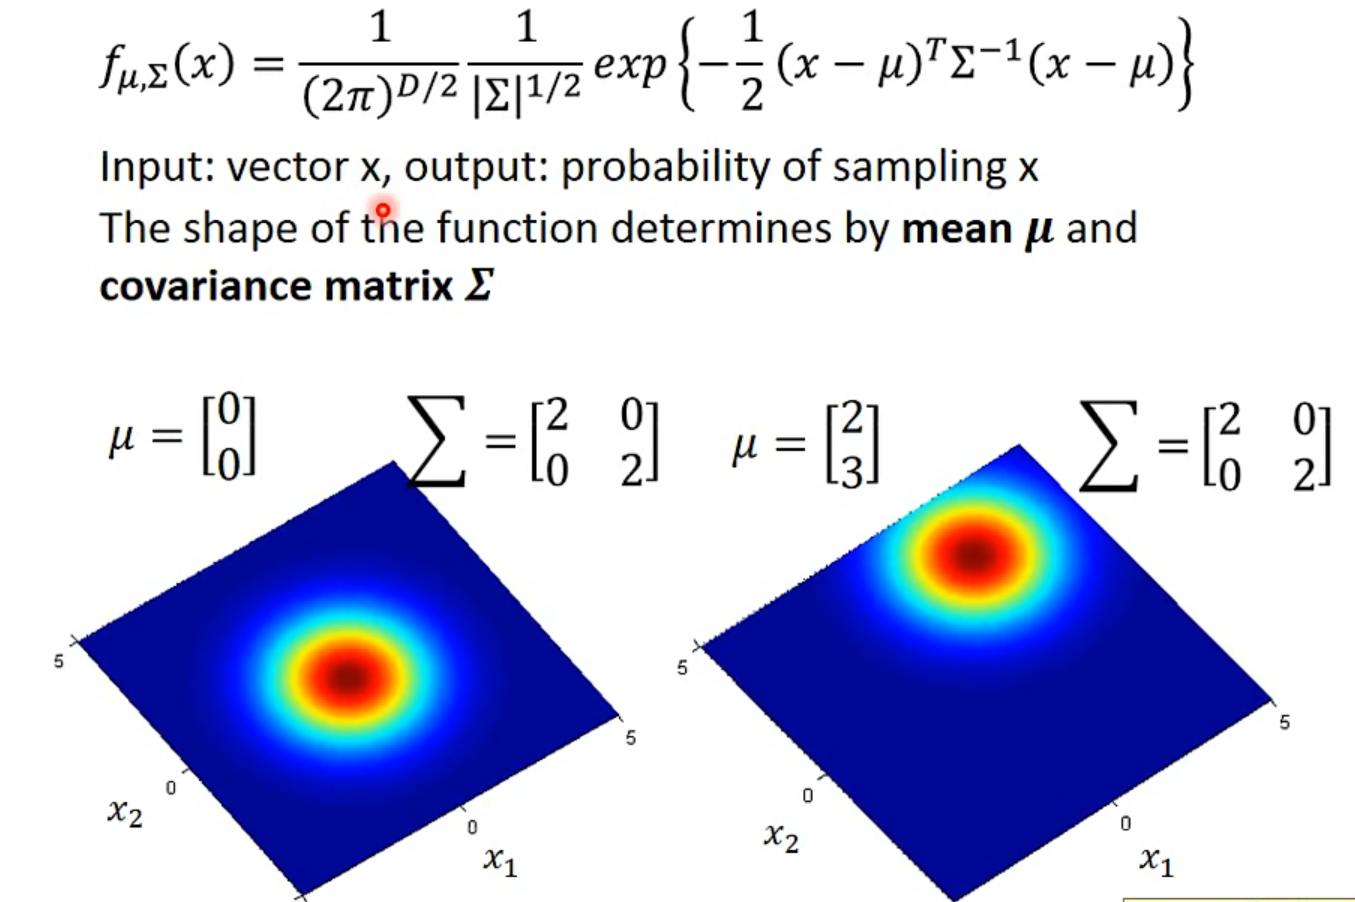
Gaussian Distribution
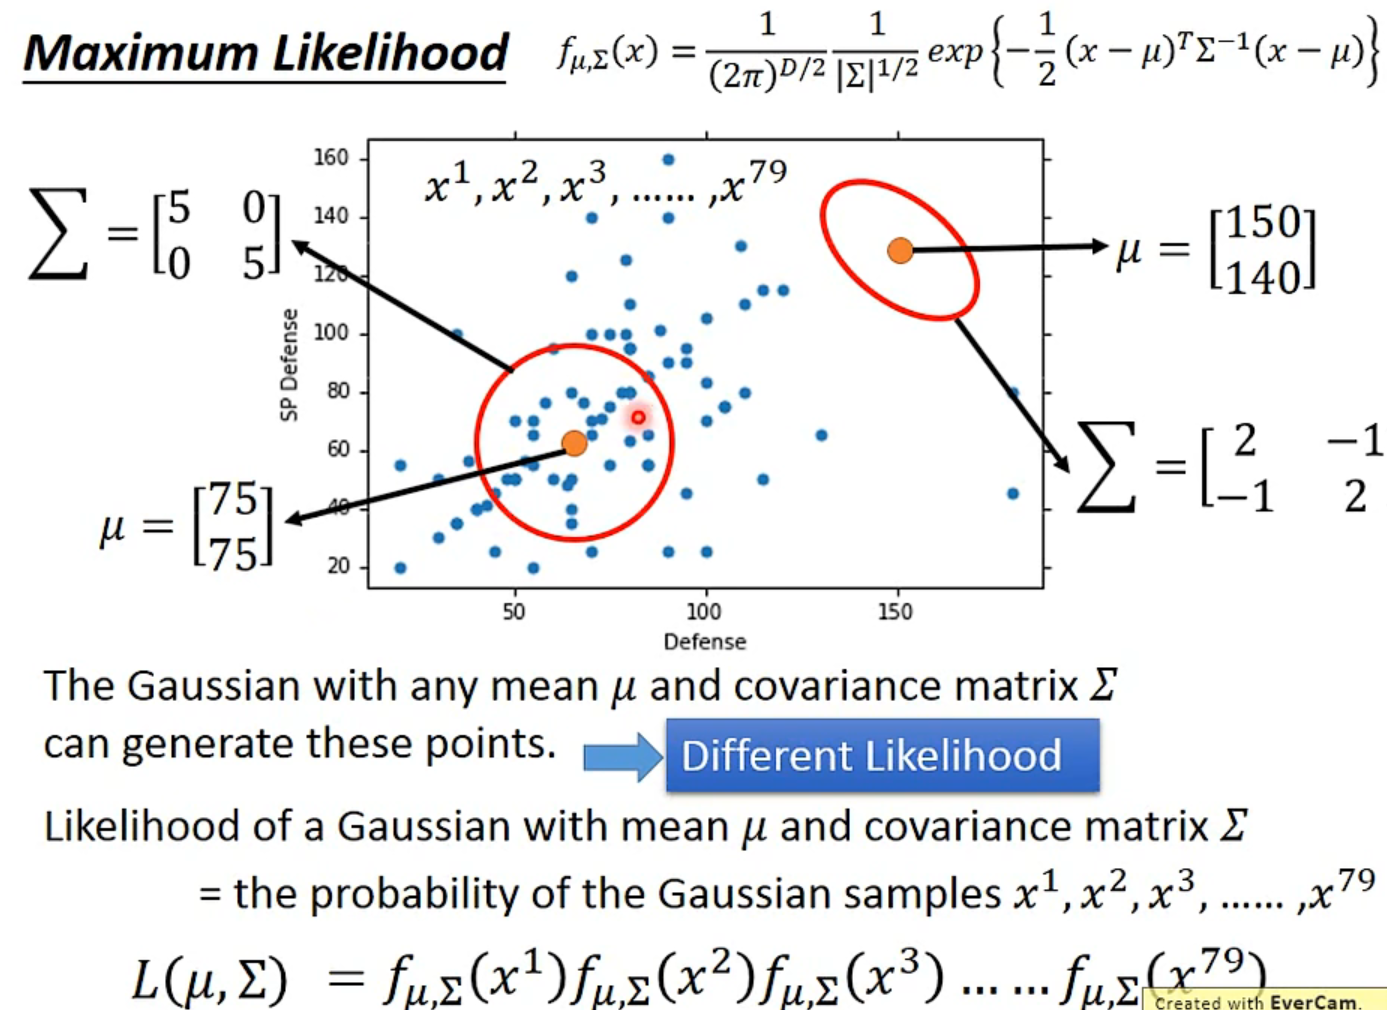
- Maximum Likelihood
Results
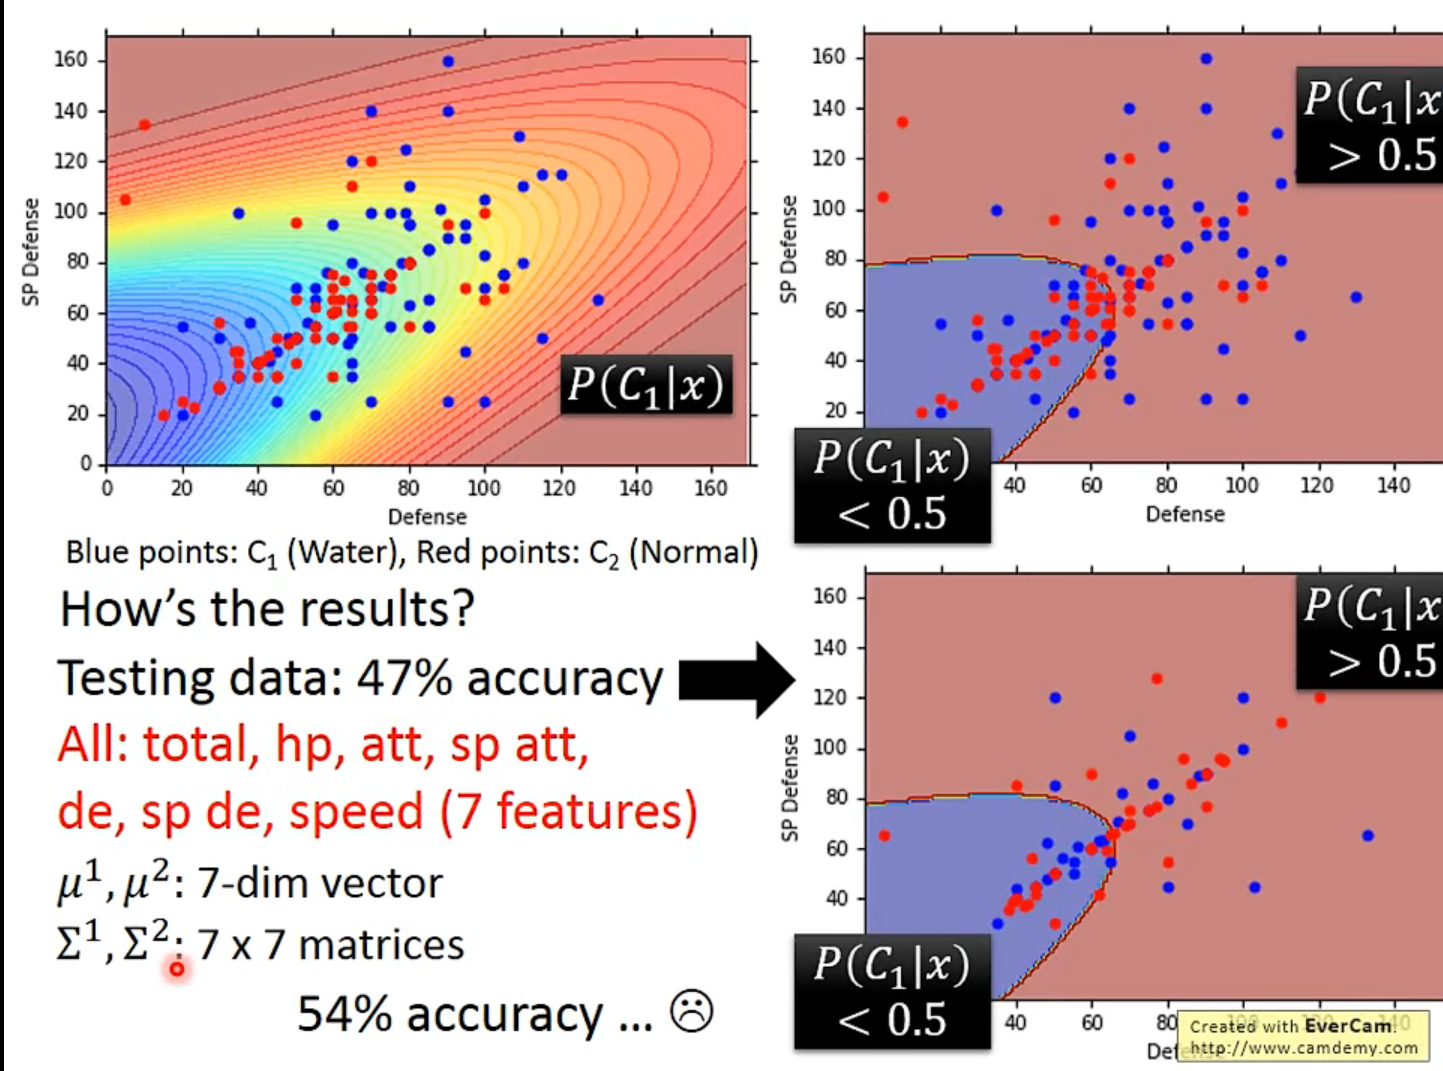
结果不好 : (
The boundary is linear-> lnear model
2、几率模型
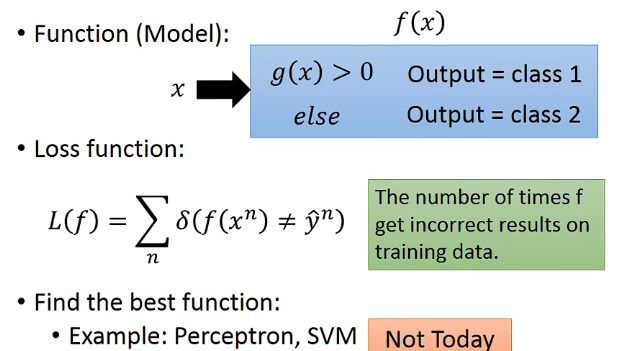
Three Steps
- Function Set(Model):
Goodness of a function
- The mean $\mu$ and covariance $\sum$ that maximizing the likelihood(the probaility of generating data)
Find the best function:easy
Probability Distribution
whatever you like
Posterior Probability
三、Logistic Regression
Step1
见上分析
Step2
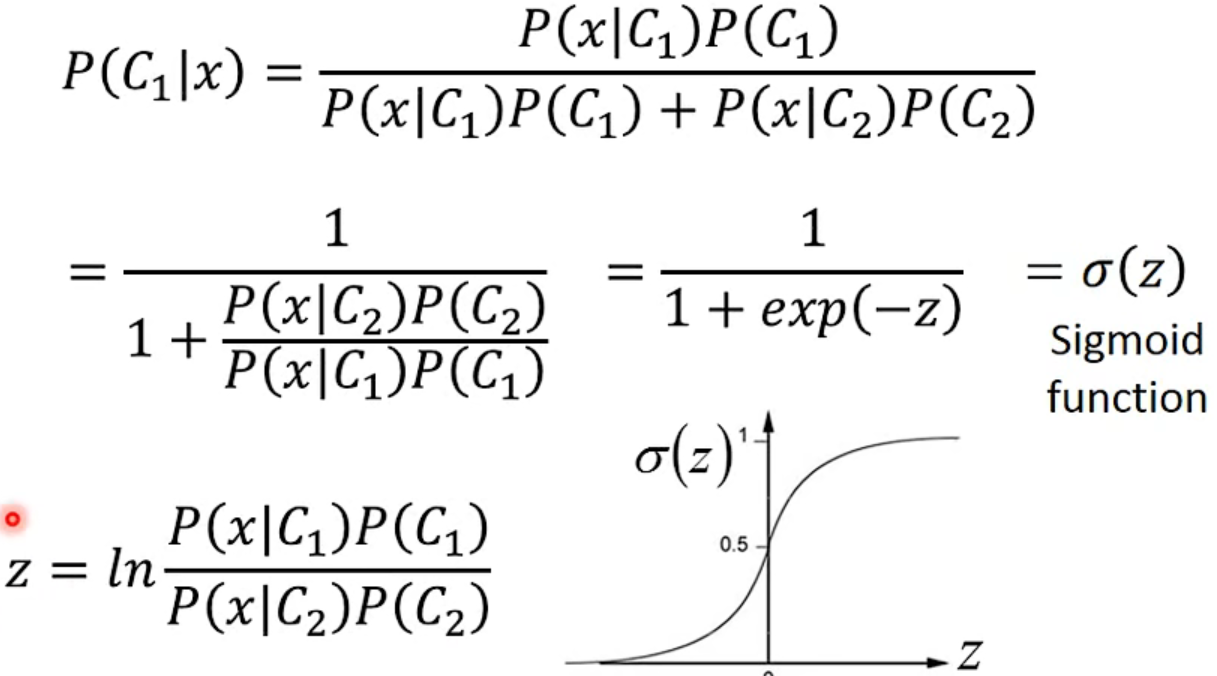
Goodness of a Function
省略一堆数学推导
- 得出一个Logistic Regression & Linear Regression的对比图
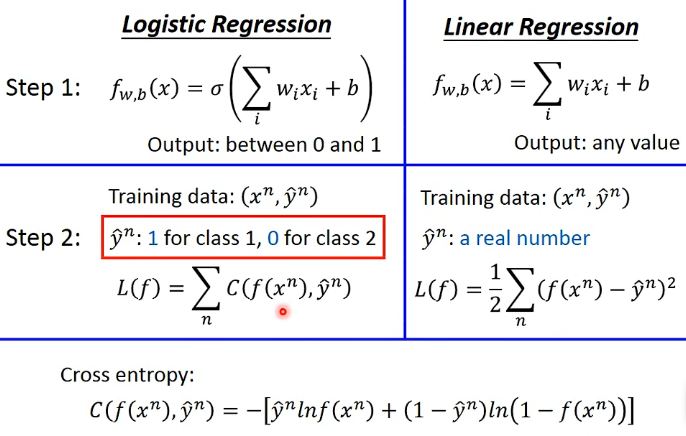
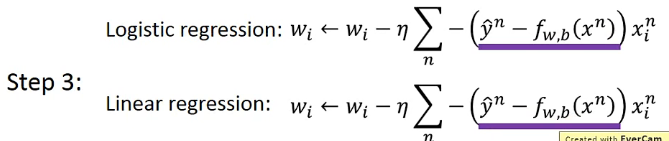
Set3
Find the best function
省略一堆数学推导
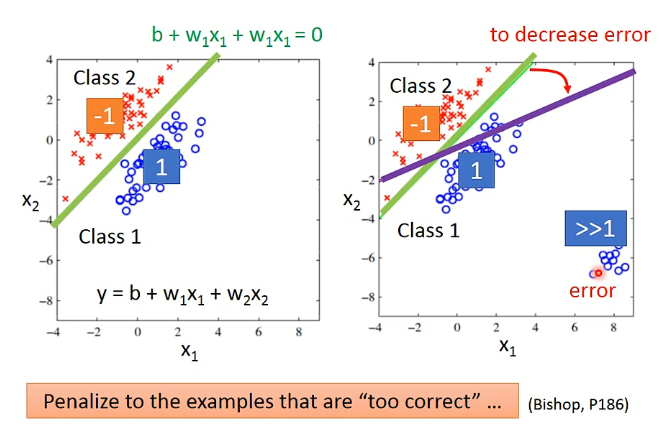
—>Larger difference, larger update.
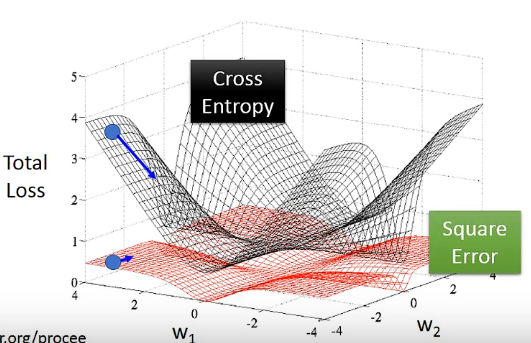
另一种解答方式
Logistic Regression + Square Error
- Cross Entropy v.s. Square Errror
Discriminative v.s. Generative
- Discriminative: Logistic Regression的方法
- Generative: 用Gaussian来描述Historical ability
他们的model & function set一样
The same model (function set), but different function is selected by the same training data.
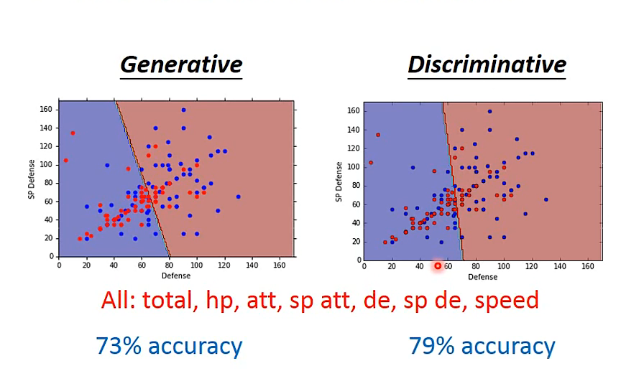
有人会说Discriminative更好
Above all
- Benefit of generative model
- With the assumption of probability distribution, less training data is needed
- With the assumption of probability distribution, more robust to the noise
- Priors and class-dependent probabilities can be estimatedfrom different sources
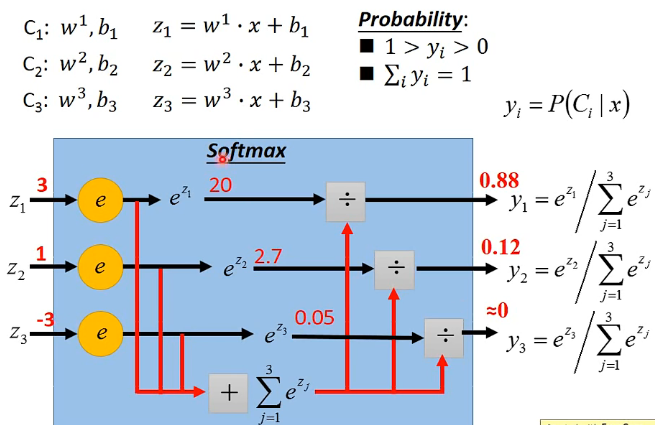
Muti-class Classification
Limitation of Losgistic Regression
How to avoid?
Feature Transformation
- Not always easy to find a good transformation
Cascading logistic regression models
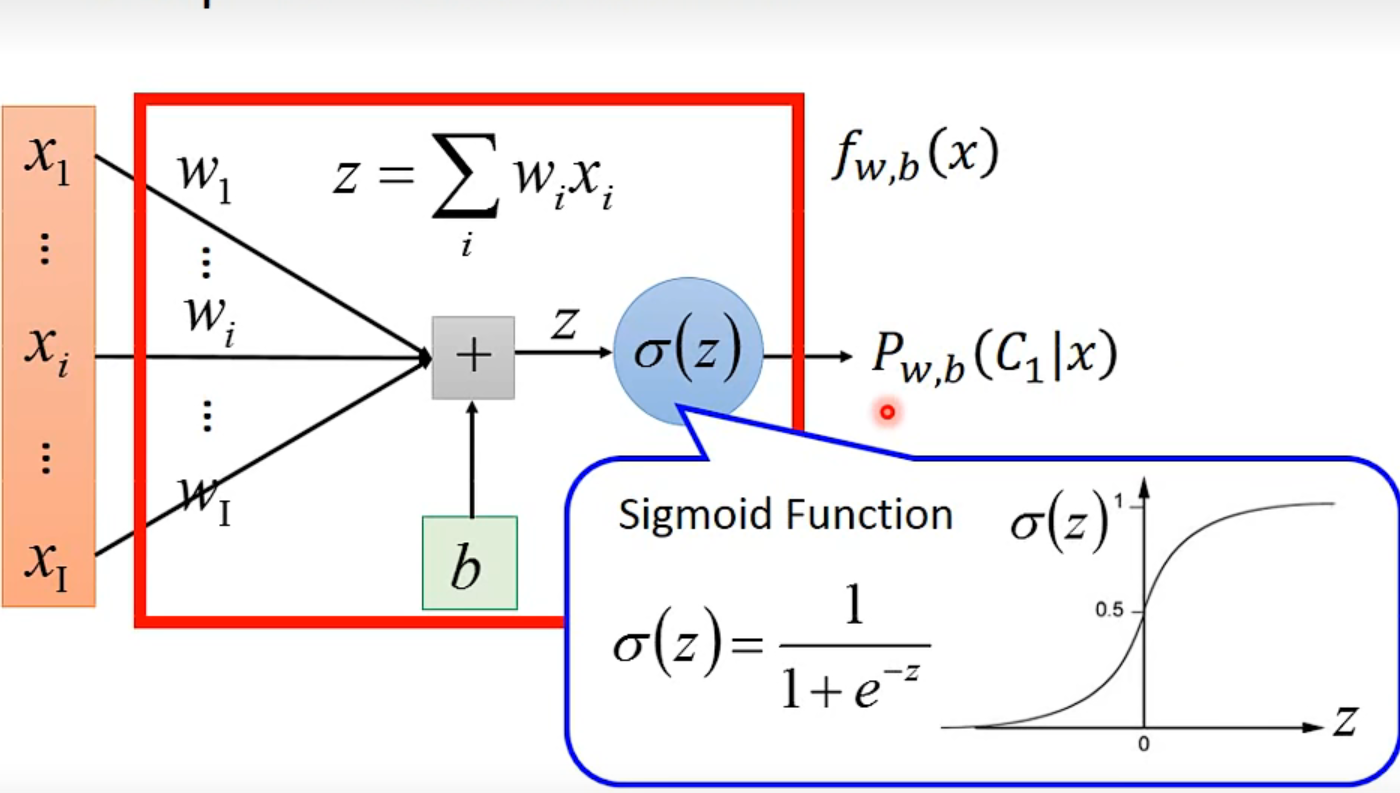
Neural Network
->Deep Learning !!!
四、Deep Learning
Deep learning attracts lots of attention.
1、Up and downs of Deep Learning
略
2、Three Steps for Deep Learning
- Step 1: define a set of function
- Step 2: goodness of function
- Step 3: pick the best function
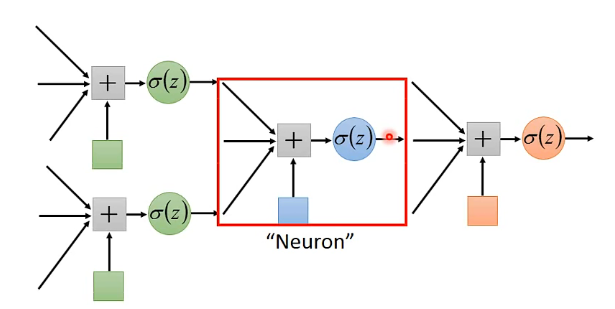
Neural Network
Different connection leads to different network structures
Network parameter $\theta$ :all the weight and biases in the “neurons”
最常见的连接方式:
- Fully Connect Feedforward Network
Given network structure, define a function set
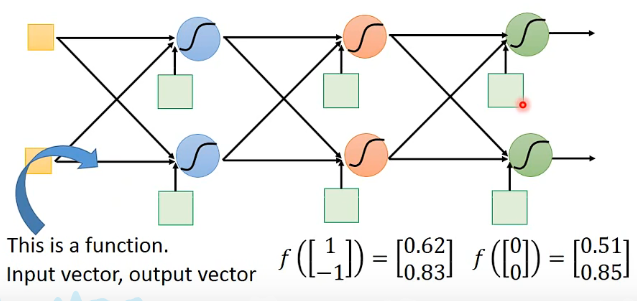
Deep = Many hidden layers
Matrix Operation
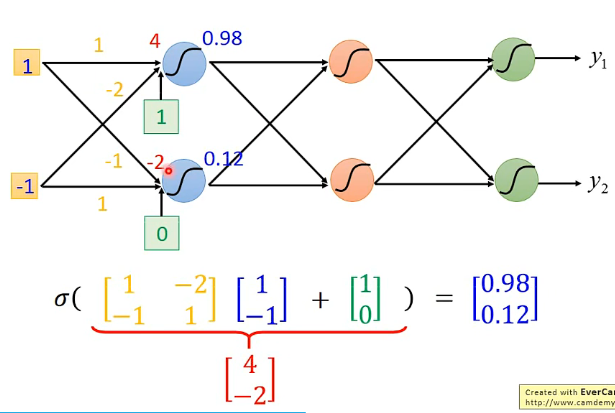
- Using parallel computing techniques to speed up matrix operation
Output Layer
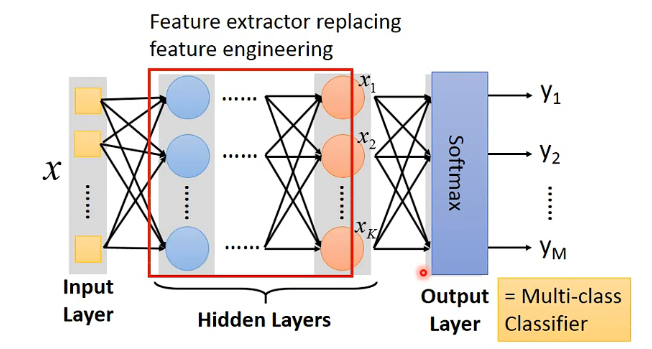
You need to decidethe network structure to let a doog function in your function set.
Q: How many layers?
A: Trial and error +Intuition
Q: Can we design the net structure?(乱接)
A: Convolutional Neural Network(CNN)
Total Loss
- Find a function in function set that minimizes total loss L
- Find the network parameter $\theta^*$ that minimize total loss L
total loss->Gradient Descent
Why deeper?
……